The Virtues of Asset Allocation [Chart]
Preet
Publish date: Fri, 28 Oct 2011, 12:35 AM
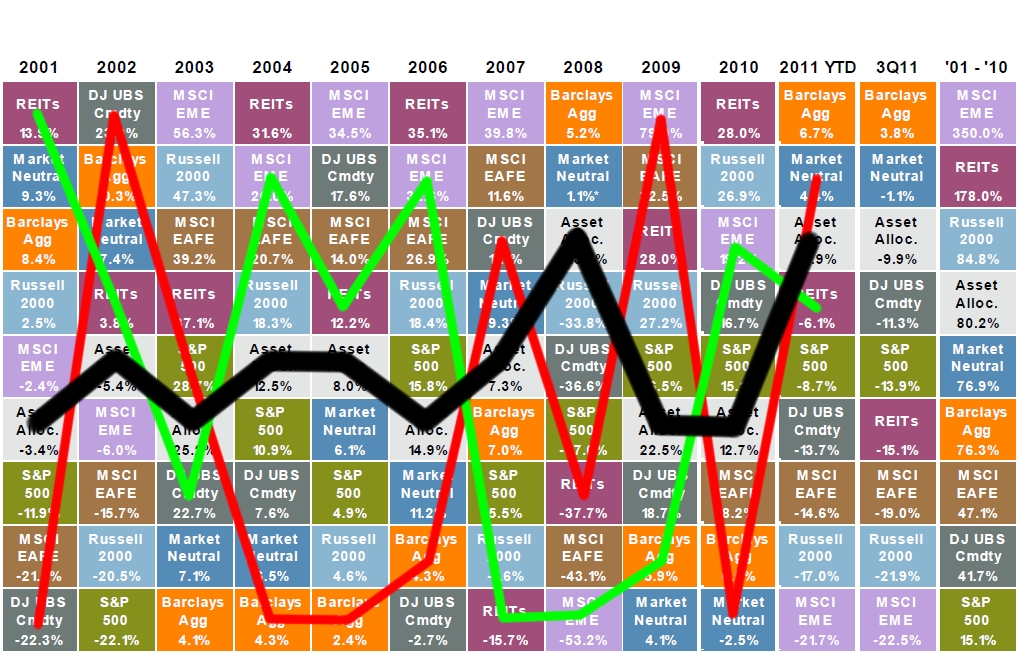
The chart at the bottom of the post shows the calendar year returns for various asset classes. I’ve annotated it with some lines to show the return path of three different investing strategies.
Asset Allocation Portfolio
If you took an 'Asset Allocation' portfolio of the following weights: 25% in the S&P 500, 10% in the Russell 2000, 15% in the MSCI EAFE, 5% in the MSCI EMI, 30% in the Barclays Capital Aggregate, 5% in the CS/Tremont Equity Market Neutral Index, 5% in the DJ UBS Commodity Index and 5% in the NAREIT Equity''REIT Index, the ride was relatively smooth: you were never at the top, but you were never at the bottom. This is shown as the black line.
If you invested $10,000 starting in 2002 (I’ll explain why I didn’t use 2001 below), it would have grown to $18,664.07 by the end of 2010. This is a cumulative return of 86.64% with an annualized return of 7.18% a standard deviation of 14.09. The sharpe ratio is 0.44 (risk free rate of 1%).
Performance Chasing
If you instead tried to chase performance and only invested in the previous year’s best asset class (shown as the green line) the results are quite different. Now you can see why I am starting with the 2002 numbers for the performance calculations: the earliest I could start was 2002 because the chart doesn’t have the 2000 numbers to determine what the 2001 portfolio would look like.
If you invested $10,000 starting in 2002, it would have grown to $11,890.35 by the end of 2010. This is a cumulative return of 18.90% with an annualized return of 1.94% and a standard deviation of 24.90. The sharpe ratio is 0.04.
Contrarian Investing
If you had the nerve to do it, a contrarian strategy of investing only in the previous year’s worst performing asset class (shown as the red line), gave you the most amount of dollars, but also came with a wild ride.
If you invested $10,000 starting in 2002, it would have grown to $21,457.45 by the end of 2010. This is a cumulative return of 114.57% with an annualized return of 8.85% and a standard deviation of 29.44. The sharpe ratio is 0.26. Since this is less than the 0.44 of the asset allocation portfolio, it means you were not being compensated adequately for the extra risk in the portfolio (volatility) even though the annualized return was higher.

Courtesy J.P. Morgan Asset Management
Source: Russell, MSCI, Dow Jones, Standard and Poor's, Credit Suisse, Barclays Capital, NAREIT, FactSet, J.P. Morgan Asset Management.The 'Asset Allocation' portfolio assumes the following weights: 25% in the S&P 500, 10% in the Russell 2000, 15% in the MSCI EAFE, 5% in the MSCI EMI,30% in the Barclays Capital Aggregate, 5% in the CS/Tremont Equity Market Neutral Index, 5% in the DJ UBS Commodity Index and 5% in the NAREIT EquityREIT Index. Balanced portfolio assumes annual rebalancing. All data except commodities represent total return for stated period. Past performance is notindicative of future returns. Data are as of 6/30/11, except for the CS/Tremont Equity Market Neutral Index, which reflects data through8/31/11. '10-yrs' returns represent cumulative total return and are not annualized. These returns reflect the period from 1/1/01 ' 12/31/10. Data are as of 9/30/11.
More articles on WhereDoesAllMyMoneyGo
Created by Preet | Nov 01, 2021
Created by Preet | Nov 01, 2021
Created by Preet | Jul 06, 2020
Created by Preet | Sep 20, 2019
Created by Preet | May 24, 2019
Created by Preet | May 08, 2019


